Enhancing OpenText WebReports with DataTables: Sorting, Pagination, and More
In today’s fast-paced business environment, clear and actionable data presentation is crucial for informed decision-making. While OpenText WebReports offers a solid foundation for creating custom reports within Content Server, it often lacks the interactive elements that can make data truly impactful.
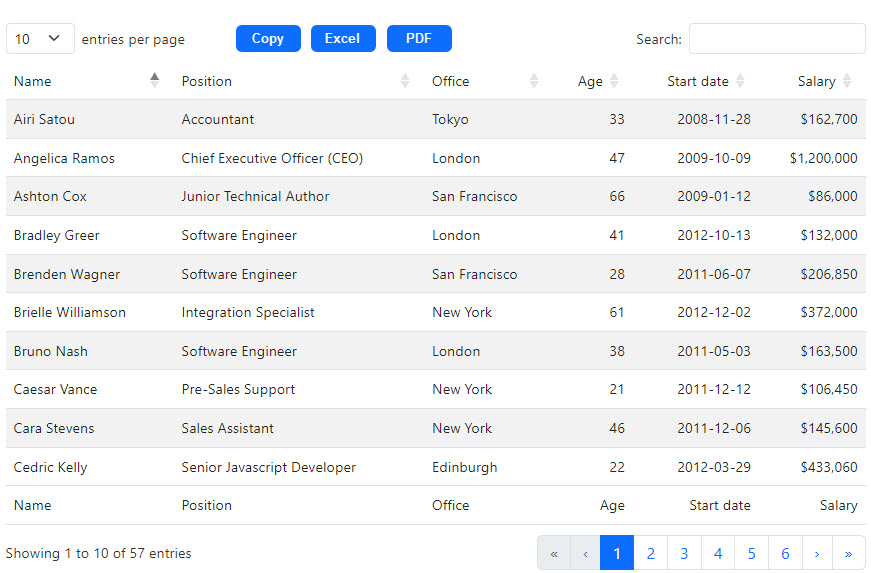
Enter DataTables—a powerful jQuery plugin that transforms standard reports into dynamic, user-friendly tools with features like sorting, pagination, quick filtering, and Excel export. By integrating DataTables into your WebReports, you can elevate your data presentation, enabling your team to access and act on insights faster and more efficiently. This article will show you how to seamlessly add DataTables to your OpenText WebReports, enhancing their functionality and delivering a superior user experience.

Why Use DataTables with OpenText WebReports?
Integrating DataTables with WebReports offers numerous benefits:
- Enhanced Data Interaction: Users can quickly sort and filter data directly within the report, making it easier to find relevant information without navigating away from the page.
- Efficient Data Navigation: Pagination capabilities allow large datasets to be split into manageable chunks, improving page load times and user experience.
- Export Functionality: With built-in support for exporting data to Excel, PDF, or CSV, DataTables simplifies the process of sharing and analyzing report data.
- Responsive Design: DataTables can automatically adjust to various screen sizes, ensuring that your WebReports are accessible and easy to use on any device.
Integrating DataTables with OpenText WebReports
To integrate DataTables into your OpenText WebReports, follow these steps:
1. Include DataTables in Your WebReport
First, you need to include the DataTables library in your WebReport. You can host the library locally or link to a CDN. Add the following lines within the <head> section of your WebReport HTML output:
<link rel="stylesheet" type="text/css" href="https://cdn.datatables.net/1.11.5/css/jquery.dataTables.min.css">
<script type="text/javascript" charset="utf8" src="https://code.jquery.com/jquery-3.5.1.js"></script>
<script type="text/javascript" charset="utf8" src="https://cdn.datatables.net/1.11.5/js/jquery.dataTables.min.js"></script>
2. Structure Your WebReport Output as an HTML Table
Ensure your WebReport output is structured as a standard HTML table. DataTables will target this table to add its functionality. Here’s a basic example:
<table id="webreport-table" class="display">
    <thead>
        <tr>
            <th>Column 1</th>
            <th>Column 2</th>
            <th>Column 3</th>
        </tr>
    </thead>
    <tbody>
        <tr>
            <td>Data 1</td>
            <td>Data 2</td>
            <td>Data 3</td>
        </tr>
        <!-- Additional rows -->
    </tbody>
</table>
3. Initialize DataTables in Your Script
Next, initialize DataTables in a script tag or external JavaScript file. This will activate DataTables’ features on your HTML table:
<script>
$(document).ready(function() {
    $('#webreport-table').DataTable({
        paging: true,
        searching: true,
        ordering: true,
        info: true,
        dom: 'Bfrtip',
        buttons: [
            'copy', 'excel', 'pdf'
        ]
    });
});
</script>
4. Customize DataTables Features
DataTables is highly customizable. You can enable or disable features such as searching, pagination, and exporting based on your needs. The dom and buttons parameters in the initialization script control the layout and available export options.
Conclusion
Integrating DataTables with OpenText WebReports is a straightforward yet powerful way to enhance your data presentation. By adding features like sorting, pagination, quick filtering, and export capabilities, you can make your reports more interactive and useful to end-users. Whether you’re managing records, tracking documents, or analyzing business data, DataTables can help you get the most out of your OpenText WebReports.
Download a copy of this WebReport here.
If you have follow-up questions or need help developing WebReports, please reach out here: techquestions@nanavaticonsulting.com